fbpx
Home Blog Page 1002

Rethinking Your Career

0
Rethinking Your Career

By now, we’ve heard of “the great resignation”. If you haven’t, it’s a term that was coined in 2021 and spurred by the global pandemic. Under this great resignation, companies and organisations saw many of their staff resign from their jobs. There are many factors that influenced this great move and continue to be of concern to employers. The tide is still turning on this great move. If you weren’t part of the crowd that resigned but have considered it, why not take this time as we reflect on the year gone by and to rethink your career.

The shift

Am I in the right job? Is my job fulfilling? Is it time to priortise other aspects of my life? Pertinent questions that you should ask and prompted the big shift in people’s employees during the peak of the pandemic. And these are some of the questions that prompted many employees to rethink their careers amid the great resignation. People are looking for more flexible working environments, they want to achieve better work-life balance and have job satisfaction and fulfillment to some degree. Great questions to ask yourself every-so-often in your professional career. But what does this mean for you and me?

The great rethink

The great rethink triggers you to ponder whether you fit in with your company’s culture. Are you comfortable with your career growth and advancement opportunities in the company? Are you treated fairly? Are their policies in line with your values? If nothing changed in the company in the next year, two years or even five, would you still be happy?

If you’ve spent time on these questions and the answers aren’t indicative of a positive shift towards your goals and values, you are in the right space to think about what you want, value, and pin down what your life and career goals are. And then you need to begin searching for companies that “tick all the boxes.” You are allowed to rethink your career options. You can make a change. But the transition and the next steps are hard.

We’ve put together some helpful tips to help you along your way.

The next steps

The first thing to think about is what you do. Before deciding on a career shift that could leave you in the same situation in 18 months, you need to ask critical questions. You also need to come up with a career strategy that will get you the results you want. This will take time and work. And it definitely won’t happen overnight.

  1.     Make work more enjoyable

Your thinking reveals that you do need a change. Before making the leap to another company, talk to your manager and find out if you can explore a different work and office set up. You may find that a hybrid working solution, more (or less) responsibilities, and flexible hours are all you need to make work more enjoyable.

  1.     Take a break

When last did you take a break and go on holiday? Without your laptop or answering work emails by the pool? A step away and break could be all you mind needs to recharge and feel rejuvenated about your job again.

  1.     Find out who you are

Alison’s Personality Test enables you to realise your career dreams by providing you with an extremely accurate report of who you are and why you do things the way you do.

  1.     Invest in your skills

If you’ve found that the career you should be in doesn’t match with where you are, you can upskill yourself in preparation for your new career. Refresh your skills, learn a new language, or learn something completely new. Alison has over 400+ courses across a variety of subjects that you learn for free. This newfound knowledge will come in handy when applying for new jobs.

  1.     Get a mentor

This is an often-overlooked area in our careers. We maintain a small circle of professional friends and acquaintances, often in similar industries and influence our decisions. Having a mentor will challenge you, give you critical feedback and encouragement. Mentors can also help you expand your professional network and provide you with leads and recommendations about what steps you can take.

  1.     Build your brand

An interview is your sales pitch. You are selling your skills, values, and experience to potential employers. it’s essential therefore that you have a resume to match. Your Alison profile is a great tool that you can share on social platforms and with employers that tell people who you are. Your profile can serve as your personal brand. Think about who you are, what you’re selling and make sure your resume and profile reflects this.

  1.     Have an action plan

Set some goals. What do you want to do or achieve, where do you want to go career-wise, how do you plan on getting there, and what tools do you need to ensure you reach your goals? Break these down into weekly, monthly, and even yearly goals. Place them where you can see them often to help you keep track of how you’re doing and a steady reminder to change track if one is achieved or perhaps not working.

Whether you choose to stay or go, know that nothing is ever set in stone. You don’t have to stay in a work environment that is toxic. And neither should you feel obligated to stay to “fix” what doesn’t work in the office or hope for changes when no efforts are being made toward it. Only you can decide what works for you. And when you’re ready, make the leap. You can have the career of your dreams.
How 8 People In Tech Explain Their Jobs To Less-Technical Family & Friends

0
How 8 People In Tech Explain Their Jobs To Less-Technical Family & Friends

You know the scene: You’re at a holiday gathering with relatives you haven’t seen in a while, or you’re accompanying your partner to their work happy hour, or you’re just sitting quietly at a dinner party, and someone asks you what you do for a living. If you work in tech, your answer might be long-winded.

Telling your in-laws or your 3-year-old nephew that you’re a Back-End Engineer probably doesn’t convey what it is you actually do all day — job titles rarely paint a full picture of someone’s career and work life. But instead of rolling your eyes or dismissing your well-meaning friends and family members for not “getting it,” why not take the opportunity to share what it’s like to work in tech and why you’re passionate about it?

Translating your highly technical career into a digestible sound bite is tricky, especially when you’re put on the spot in a social setting. To help you field these (very reasonable) types of questions, we asked Codecademy team members how they explain coding and their tech jobs to non-technical people in their lives. Read their responses and consider trying them out this holiday season. Who knows? Your thoughtful answer might inspire someone to learn to code who never considered it before.

How to explain coding…

“Code is writing instructions for a computer to follow in a language that it understands. Since I do web development, I write mostly JavaScript or TypeScript. When you go to a website that I’ve written code for, your browser asks a server for the site content. Some of the code I write is instructions for that server to get the right content and send it back to your browser, and some of the code is instructions that run in your browser to make the website display correctly and be interactive.” – John Rood, Senior Software Engineer

“Think of coding as tools in a tool box, different languages are used for different situations.” – Adam Herman, Curriculum Program Manager

How to explain computer programming…

“Programming is how we teach computers what to do, how to do it, and when to do it.” – Fede Garcia Lorca, Community Manager

“I happened to be showing my kids some Kodable videos where they explained variables and loops in a kid-friendly way. Then, I said, ‘That’s what I do at work!’ And they go, ‘You program?!’” – Julie, Software Engineer

How to explain data science…

“As a Data Scientist, I tell my parents, ‘They pay me to do math.’ To be honest, I don’t think it’s a helpful answer.” – Brit, Senior Data Scientist

“Data science is like cooking a special holiday recipe, asking your family how it tastes, and then adjusting the recipe for next year based on what they say. You’ve collected data, cleaned it (ignoring, for example, that one cousin who always gives joke answers and asked for more M&Ms in the soup), and figured out what actions the data indicates.” – Ada Morse, Curriculum Developer, Data Science

“We can use data on past experiences to have an idea of how likely something is. The more good data and context we have, the better we can predict things. Computers can do the same thing. The more computing power something has, the more info it can take in to make predictions. At the end of the day, there’s no magic… just statistics and really powerful computers.” – Eva Sibinga, Curriculum Developer, Data Science

How to explain project management…

“I basically talk about project management for, like, a construction company, so it’s a bit more tangible. Then I replace the physical items with the digital items and explain how it’s similar. The crux is: I’m responsible for making sure projects are planned, resourced, and completed on time and on budget, while also putting out fires along the way.” – Megan McCoy, Curriculum Project Manager

Hopefully these responses will help you demystify coding to your loved ones, so they can better understand what you do and why. Tech can be intimidating, and there’s no question too basic to ask. Even people who’ve worked in tech for years might not understand the scope of their teammates’ roles — which is all the more reason to ask.

You can read all about the unique and rewarding careers you can have in tech, the coding skills you need to break into the business, and more on the Codecademy blog. And if someone you chat with this holiday season is interested in learning how to code, or pursuing a career in tech, be sure to suggest signing up for a Codecademy account! We have lots of beginner-friendly Codecademy courses, career paths, and tutorials that will help answer their pressing questions.

How To Make A 2022 Hype Doc For Your Coding Accomplishments — & Why You Should Do It

0
How To Make A 2022 Hype Doc For Your Coding Accomplishments — & Why You Should Do It

As you re-listen to your Spotify Wrapped playlist and feel nostalgic looking at your top-liked Instagram posts of the year, there’s another important metric in your life that you should reflect on: your coding accomplishments.

It’s easy to lose track of the positive strides that you personally have made over the course of your coding journey. That’s one reason why Software Engineer Aashni Shah created a tool called HypeDocs to help people keep an up-to-date record of all their wins. Aashni was introduced to the idea of a “hype” document while she was working as a Software Development Engineer at Square.

The premise of a hype document is pretty straightforward: Start a running list and regularly update it with things that you’re proud of. Anything can count as an accomplishment, like completing a coding project from start to finish, finding a convenient time for a pair-programming session, or meeting your weekly learning target on Codecademy. (Read this blog for more examples of small — but significant — milestones that you should celebrate as you’re learning to code.)

As the name suggests, a hype document is designed to give you a confidence boost by acknowledging your successes. It’s also a way of keeping receipts for all your hard work and contributions that may not get recognized by other folks on your team, which is essential when you’re vying for a promotion or working on your annual performance review.

“Especially for women and underrepresented folks, we face so many other additional issues at work — for example, impostor syndrome, and generally being overlooked for work that we’ve done,” Aashni says. “This helps us build a quantified way to track qualified work, which we don’t do any other way.”

This is a framework that anyone can use at any stage in their career, from beginners who are just learning to code to folks in full-time developer positions. Ready to start hyping yourself up more often? Here are a few ways that you can start, maintain, and take advantage of your own hype document.

Make a running document

There are a number of different ways that you could format your personal hype document. For example, you could use Google Docs and simply list your achievements with bullet points, or a spreadsheet with Google Sheets where you can add dates and record how it ladders up to a specific goal. Or maybe you’d rather have an analog journal where you can record your wins by hand. Some people might prefer Notion or other digital organizational tools — what matters most is that it makes sense to you.

Like any resourceful developer, Aashni coded a HypeDocs platform so anyone can incorporate the practice into their workflow. “This was introduced to me as: Here’s a Google Doc, write down all the things you’re proud of — and I love that concept,” she says. “But my engineering mind kind of went, Ooh, I want more.” HypeDocs automatically prompts you to update your document, sends you weekly reminders of your accomplishments, plus has a goal-setting feature.

Host a hype meeting

While working at Square, Aashni would meet once a week with a group of other women software engineers at the organization. When hype documents started to catch on across the organization, the meetings morphed into a weekly lunch where the engineers got together and discussed their achievements. “It was just the most incredible way to really, genuinely support each other, and it really bonded us in the office as well,” Aashni says.

See if your colleagues or team members would be willing to get together IRL or remotely a couple times a month to talk about your individual and collective wins or struggles. Aashni calls these groups “hype pods.” Not only is this a chance for you to celebrate your own accomplishments and give out well-deserved kudos, but it’s also a great way to learn about what your peers are working on, and see who might need some support.

(Hot tip: If you follow Codecademy on Instagram, you can share your wins of the week — coding-related or not — with us every Friday. It’s a great way to wrap up the week and get some inspo from other Codecademy learners.)

Leverage it

Your hype document can be just for you or something that you share openly with your team leader during one-on-one meetings. “The way for it to be most effective is if you have a mentor, a guide, or a manager to go through it with you, especially if it is something you’re using to build your career,” Aashni says.

Ideally, you’d be updating your hype document and referring to it often. But there are certain times in your career when you should definitely reference your list, for example, when you’re completing a self-evaluation for your performance review, or if you’re making a case to ask for a promotion. The facts on your hype document don’t lie — and your team leader will appreciate how clear and organized your document is. You might feel awkward at first, but “there’s so much power that comes from being able to share your wins,” Aashni says.

Lastly, don’t forget that your hype document is a tool that’s supposed to bolster you as well. “On a day where you feel down, whether you got rejected from a job offer or you just need that pick-me-up, it’s a great way to just go through and be like, You know what, today was crap, that’s fine. I’ve done all these other things as well.”

Hype docs are just one strategy you can use when you’re setting work goals. Be sure to check out the Codecademy blog for career advice, job interview tips, and more inspiration.

How To Use Raspberry Pi To Code Your Holiday Decorations

0
How To Use Raspberry Pi To Code Your Holiday Decorations

Whether you take a Clark Griswold approach to your home’s holiday light display, or are more of a Charlie Brown minimalist, ‘tis the season for twinkly lights everywhere you look. With some savvy programming skills and a Raspberry Pi computer, you can code a custom holiday light display — and we’ll teach you how.

If you’re not familiar with Raspberry Pi, “it’s basically a full computer in the size of a credit card,” explains Jace Van Auken, Codecademy Curriculum Developer who worked on the Learn Raspberry Pi course. Raspberry Pi was invented in 2012 by a programmer named Eben Upton, who was inspired to make a low-cost hobby computer similar to the one he grew up using in the ‘80s, called the BBC Micro.

The single-board computer might look bare bones or unassuming, but it’s capable of much more than meets the eye. “Raspberry Pi is super powerful and it continues to get more powerful,” Jace says. What’s so neat about Raspberry Pi is that it’s not only a practical tool for learning programming and computing, but it can also be used for creative pursuits and fun stuff that’s purely for entertainment purposes. In fact, Raspberry Pi is a go-to tool for STEAM (short for Science, Technology, Engineering, Art, and Math) projects.

Given that, we’re going to show you how to use Raspberry Pi to make holiday decor. Jace will explain how you can use your Raspberry Pi to create a light display that animates and changes colors. With a LED string light, your Raspberry Pi kit, coding knowledge, and some imagination, you’ll be decking your halls with code in no time.

The coding skills you need for this project

This project is a fun, hands-on opportunity to learn how to use Raspberry Pi, but you need some background knowledge before you get your hands dirty. Working with hardware and wires might be a little bit intimidating at first, and it’s not as straightforward as other projects where you’re just writing code. You can learn the skills you need for this project in the free Codecademy course Learn Raspberry Pi.

Raspberry Pi runs on the open-source operating system Linux. You can use lots of different programming languages with Raspberry Pi, but Python tends to be the most popular. There’s even an integrated development environment (or IDE) for Raspberry Pi called Thonny that comes with Python built-in. In Learn Raspberry Pi, you’ll get introduced to the command line and Linux operating system, plus you’ll learn the ins and outs of the hardware and software that’s used for Raspberry Pi projects.

If you’re new to coding, we have lots of other beginner-friendly courses that will set you up to complete this Raspberry Pi project — and start dreaming up your own projects. Start by checking out the free Codecademy course Learn Raspberry Pi. For a more in-depth look at Linux, you might want to try Introduction to Linux or Learn the Command Line. We also have lots of Python courses for all levels, like the popular beginner course Learn Python 3 or the free intermediate course Python for Programmers.

Gather these supplies

Here’s what you need in order to make a holiday light display with Raspberry Pi.

  • Raspberry Pi: You’ll need a Raspberry Pi computer with power for this project. Any RPi variation will work, and there are lots of options available at different price points that you can browse on the Raspberry Pi website. We recommend the Raspberry Pi 400 kit, which has a Raspberry Pi 4 built into a keyboard and comes with all the accessories you need to get started (a mouse, power supply, and monitor adapter).
  • Addressable LED strand: Find flexible strand lights that are “addressable,” which means that each LED light can be individually programmed to create animations or custom displays. We used this inexpensive option on Amazon.
  • Protoboard: Also known as a “breadboard,” this is a surface with rows and columns of holes that you can use to prototype circuits.
  • 5V power supply, 2 Amps: In order to properly power your Raspberry Pi, you need a 5 Volt power supply around 2 Amps.
  • Level-shifting chip: A level-shifter is necessary because the Raspberry Pi data ranges from 0-3.3V, but the LEDs want data from 0-5V. In many cases, the 3.3V data will work for the LEDs but isn’t a guarantee. You can find the integrated circuit we used by searching the product number: 74LS245N.
  • Hookup wire: This is the type of wire that you use when you build circuits with a protoboard. You’ll need Female/Male jumper wires for this project.

Start coding your holiday lights with Raspberry Pi

Before you jump in and start this project, spend some time tinkering around with Raspberry Pi. In the free Codecademy course Learn Raspberry Pi, we’ll walk you through how to properly set up a circuit in Raspberry Pi to run an external device like an LED light. It’s a good idea to take the course to get a detailed explanation of how to use Raspberry Pi — this project will make way more sense if you have a clear understanding of the technology first.

Set up your Raspberry Pi and circuit

Got all your supplies handy? ​​Using a breadboard we’re able to supply the LEDs 5V of power, and we can use the level-shifter to pass data from the Raspberry Pi to the LEDs. You’ll want to reference this image below for the wiring:

How to set up your circuit with your Raspberry Pi and breadboard.

We can zoom in and see where we placed the wires on our Raspberry Pi. These general-purpose input/ouput (GPIO) pins allow the Raspberry Pi to control external components like lights. The black wire (on the right) is connected to pin 6 on the 40-pin header. The green wire (on the left) is connected to GPIO18, which is pin 12 on the 40-pin header. You can get a quick diagram of the Raspberry Pi’s 40-pin header by opening up the terminal and typing pinout.

A closeup of the Raspberry Pi pins.

Take a closer look at the circuit wiring in the image below. The Raspberry Pi has 2 wires connecting to the breadboard: the green wire supplies data, the black wire is your ground wire. Our breadboard has a 5V power supply, and a level-shifting IC with 3 wires going to the addressable LEDs.

(Expert tip from Jace: It’s important that every component in this project shares ground, because ground is the reference point for the different voltages in this system. In many cases, if something is not working it is because the grounds of each component were disconnected somewhere.)

Note the circuit wiring on the breadboard.

A note about safety: Be careful when you’re setting up your circuit. While the voltages and currents that come from your device’s general-purpose input/output (or GPIO) are relatively low, it’s possible to accidentally damage your Raspberry Pi and breadboard if you don’t take certain precautions. (We cover how to do this in the course Learn Raspberry Pi.)

Test your circuit

Now it’s time to write some code and test that your circuit works. Open up your terminal and run the following command to install the necessary Python modules. Be sure to use sudo (short for “superuser do”) when you run this command and your file.

sudo pip install rpi_ws281x adafruit-circuitpython-neopixel

With these modules installed, now we can turn on the lights. Run this code as sudo. If everything is set up correctly, you’ll see the first LED on your strand light up!

import board
import neopixel

NUM_PIXELS = 42

pixels = neopixel.NeoPixel(board.D18, NUM_PIXELS)
pixels[0] = (255, 255, 255)

Design your lights

Be creative and decide what shape or design you’d like to use for your lights — we chose a snowflake. Jace printed a snowflake pattern on a piece of paper, drew a dot where the lights will lay, and labeled each light with a number (1-50). He arranged the 50 LED lights so that each branch of the snowflake would contain 7 LED lights. Jace used hot glue to attach the LED strand light to the paper so the wired lights can maintain the shape of the snowflake.

We set up our LED lights like a snowflake.
It’s lit!

The following code goes further and creates functions to light up all the LEDs or just a single branch. In the main function there is an infinite loop that randomly colors each branch blue over a white snowflake. Try it out!

import time
import random
import board
import neopixel

# adjust these based on your project
NUM_PIXELS = 42
PIXELS_PER_BRANCH = 7

# color variables
RED = (255, 0, 0)
GREEN = (0, 255, 0)
BLUE = (0, 0, 255)
WHITE = (255, 255, 255)

# global neopixel instance
pixels = neopixel.NeoPixel(board.D18, NUM_PIXELS)

# fill a branch (0-6) a specific color
def fill_branch(branch, color):
start = branch * PIXELS_PER_BRANCH
finish = start + PIXELS_PER_BRANCH
pixels[start:finish] = [color] * PIXELS_PER_BRANCH

# fill all the pixels
def fill_all(color):
pixels[:] = [color] * NUM_PIXELS
if __name__ == "__main__":
	while True:
		# create random branch indexes
		branches = [0, 1, 2, 3, 4, 5]
		random.shuffle(branches)
        
		# restart all LEDs to WHITE
		# go through random indexes
		# and light up branches to blue
		fill_all(WHITE)
		time.sleep(0.5)
		for i in branches:
			fill_branch(branches[i], BLUE)
			time.sleep(0.5)

A bit of diffusion paper over the whole thing hides all the wires and showcases the LEDs so we can enjoy the programmed animation!

Show us your creations

We hope this Raspberry Pi project keeps you entertained this holiday season, and inspires you to think of more ways to combine creativity and coding. If you tackle this DIY project, we want to see your finished product! Be sure to share a photo of your own Raspberry Pi holiday lights creation and tag Codecademy on Instagram, Facebook, and Twitter.

4 Reasons Why You Should Learn Python if You Want to Work with Data

0
4 Reasons Why You Should Learn Python if You Want to Work with Data

There’s a reason why Python is frequently crowned the most popular programming language among professional developers and people learning to code. Python is an easy-to-read, versatile programming language that’s used in many different areas of software development.

For example, Python has a stellar reputation in data science, explains Ada Morse, Codecademy Curriculum Developer in Data Science. “Python’s the standard, so it’s a good one to know,” she says. Want to learn the ins and outs of using Python for data science? Our new free course Getting Started with Python for Data Science will teach you how to use Python to explore real-life datasets and answer questions using data.

The exercises in Getting Started with Python for Data Science are designed to mimic the work that you’d do as a Data Scientist or Data Analyst, so it’s a great way to test the waters and see if you like the field, Ada says. The course is also open to absolute beginners and anyone who wants to learn more about data. We’ll walk you through everything you need to know to use the main data science tools — Python, Pandas, and Jupyter Notebooks — and you’ll see firsthand what makes Python so awesome. Read on to learn more about why you should learn Python if you want to work with data.

Python has a simple, English-like syntax.

Data science can be intimidating for folks who aren’t super comfortable with numbers and math. With Python, rather than having to make sense of a jumble of complicated symbols and equations on a screen, the syntax looks like a natural (or spoken) language. Python is designed to be readable, which is one reason why it’s so approachable for coding beginners, Ada says.

Take a look at this snippet of Python code — you can probably guess what it’s supposed to do just by reading it:

name = 'Codey'
print(name + ' is learning to code')
if name is not "Codey":
print("Welcome " + name)
for letter in name:
print(letter+"!")

Since Python is so easy to learn, you can start learning more complicated concepts with it quickly. Compared to other data science languages (like Julia, for example), you don’t need as much theoretical computer science knowledge to work with Python, Ada says. “Python handles some of the technical details for you,” she says.

There are lots of handy Python add-ons.

The neat thing about Python is that there are tons of libraries and frameworks that handle standard tasks in different areas of software development, from machine learning to data science. These prewritten code packages do a lot of grunt work for you, so you can write Python code faster and build apps that are pre-organized and structured.

For example, in Getting Started with Python for Data Science, you’ll get to use Pandas, a Python module that’s used for data manipulation. “Pandas is really helpful because instead of having to reinvent how to work with tables of data, a lot of the basic code has already been written,” Ada explains. “Now your job is just to apply that to the dataset that you want to work with.”

Some go-to Python libraries for data science include NumPy, MatPlotLib, and SciPy. Read this blog to learn more about the various Python libraries and tools that you can take advantage of while learning the language.

You can build other cool things with Python.

Python is not strictly a data science language; you can use it to create websites, test software, and build machine learning models. The course Getting Started with Python for Data Science is a great introduction to common coding principles that will come up again as you work on different coding projects or learn new languages altogether. Take a look at all of Codecademy’s Python courses to get a sense of how versatile the language is — you might be inspired to explore more in-depth Python topics, like the skill path Machine Learning Fundamentals or Build Python Web Apps with Flask.

You really can’t go wrong choosing Python as a first language whether you want to pursue data science or another specialty. And once you know one programming language, it’s typically easier to pick up other ones because there are so many overlapping concepts across languages.

As a beginner, you’ll probably find yourself searching lots of different coding questions on Stack Overflow or Google. Since so many people use Python, it’s easy to find reputable resources and documentation. “You’ll be able to find tutorials or courses or something in Python, whereas a less popular language might be harder to find those sorts of resources,” Ada says.

Speaking of, Codecademy has lots of resources that you can turn to while learning Python (or any other language), including articles and explainers, our community-driven code documentation called Docs, practice projects, plus courses and tutorials.

Python is the industry-standard programming language for data science. “The popularity of Python means that most Data Scientists ‘speak’ Python to a certain degree,” Ada says. If you’re interested in having a career in data science, knowing Python will help you stand out as a serious candidate — and enable you to jump right in working on projects once you get hired.

Even if you don’t aspire to become a professional Data Scientist, knowing how to work with data is a very important and marketable skill. “It’s hard to think of a job that wouldn’t have any sort of contact with data these days,” Ada says. Becoming the go-to Python and data person at your organization can boost your career potential in any field.

Ready to learn Python for data science?

In our free introductory course Getting Started with Python for Data Science, you’ll get hands-on practice working with real datasets in Python. We’ll teach you how to work with the trifecta of data science tools: Python, Pandas, and Jupyter Notebooks. By the end of the course, you’ll be able to explore and summarize a dataset, filter data to find specific categories, and format raw data so you can answer a data question, Ada says. This course is great for absolute beginners, and will set you up nicely to take another Codecademy’s data science course.

If you’re loving using Python to answer questions about data, maybe this could be the start of a new career for you? Be sure to check out the Codecademy career paths in data science to learn the skills you need to work in this exciting area of tech.

Getting Started with Python for Data Science | Codecademy

Work hands-on with real datasets while learning Python for data science.

6 Useful Python Libraries & Tools For Data Science Beginners

0
6 Useful Python Libraries & Tools For Data Science Beginners

Python is kind of like the frozen yogurt of programming languages — it’s extremely popular and versatile on its own, but it’s even better when you add toppings. Of course, by “toppings,” we’re talking about the many Python libraries and tools that level-up what you can do with the language.

With data science, in particular, there are lots of pre-written Python code packages and extra tools that allow you to work with data in more advanced ways, explains Ada Morse, Codecademy Curriculum Developer in Data Science. In the new free course Getting Started with Python for Data Science, you’ll get to use Pandas, a Python module that’s used for data manipulation.

“Pandas is really helpful because instead of having to reinvent how to work with tables of data, a lot of the basic code has already been written,” Ada says. “Now your job is just to apply that to the dataset that you want to work with.” Pandas is just a taste of what you can do with Python, and there are thousands of additional libraries you can choose from. Curious which data science libraries and tools you should try first? Here are the most common, beginner-friendly Python libraries and tools that you can use for data science.

Pandas

This is the standard data science library that’s used for data manipulation in Python. “Anyone who does data science in Python works in Pandas — and actually, a lot of the time the vast majority of the code will be Pandas as opposed to Python,” Ada says. Pandas comes with pre-packaged code for working with tables of data that’s organized into rows and columns.

In Getting Started with Python for Data Science, you’ll start working with Pandas right away to import datasets, summarize the data, identify problems, and explore possible outcomes.

Jupyter Notebooks

In our new course Getting Started with Python for Data Science, you’ll get hands-on practice using Jupyter Notebooks, an interactive workspace for developing data science code and visualizations, Ada says. With Jupyter Notebooks, you can execute Python code, review the output quickly, and record your results just like you would in an analog notebook.

Jupyter Notebooks is an essential tool for data analysis, because you can test a bunch of hypotheses and keep a running log of your results. “Most working data scientists do their work in Jupyter Notebook,” Ada says.

If you’re a beginner who’s just learning how to code, using Jupyter Notebooks to test lines of code one at a time is super helpful. Jupyter Notebooks supports other programming languages besides Python, like R and Java. “If then you want to learn something else, chances are you can do that in Jupyter Notebooks and feel at home,” Ada says.

MatPlotLib

If you want to make compelling data visualization and graphical plots, you’ll want to use MatPlotLib. With this Python package, you can make all kinds of interactive visualizations including pie charts, heat maps, histograms, and 3D bar charts. (Take a look at this gallery to see all the gorgeous MatPlotLib data visualizations you can use in your work.) In the course Learn Data Visualization, you’ll turn data into impactful line, bar, and pie graphs.

Seaborn

Another Python add-on for data visualizations is Seaborn, which enables you to give your charts some style and flair. Using Seaborn you can adjust the background color, grids, borders, and fonts within a chart. Colors and aesthetics might seem superfluous, but when you’re trying to communicate insights with data, style can greatly affect how well your audience perceives your message. In the skill path Visualize Data with Python, you’ll work with Seaborn to style a MatPlotLib graph.

NumPy

NumPy (short for “NumericalPython”), is the standard library for working with numbers in Python, and is frequently used in science and engineering. With NumPy, you can quickly complete numerical operations and create multi-dimensional arrays and matrices. Want to understand how to use this Python library for statistical analysis? Check out the course Learn Statistics with NumPy.

BeautifulSoup

BeautifulSoup is a quirky name for a highly practical package that allows you to scrape data from the web in a format that’s suitable for Python. Once you’ve scraped your data with BeautifulSoup, you can do all kinds of things with Python, like make visualizations with MatPlotLib or analyze it with Pandas. You can learn how to use BeautifulSoup in our course Learn Web Scraping with BeautifulSoup.

Ready to start learning Python? Try our free introductory course Getting Started with Python for Data Science! You’ll get hands-on practice working with real datasets using industry-standard data science tools: Python, Pandas, and Jupyter Notebooks. Once you get familiar with Python, be sure to explore the rest of our Python courses to explore all the other cool things you can make with Python.

Getting Started with Python for Data Science | Codecademy

Work hands-on with real datasets while learning Python for data science.

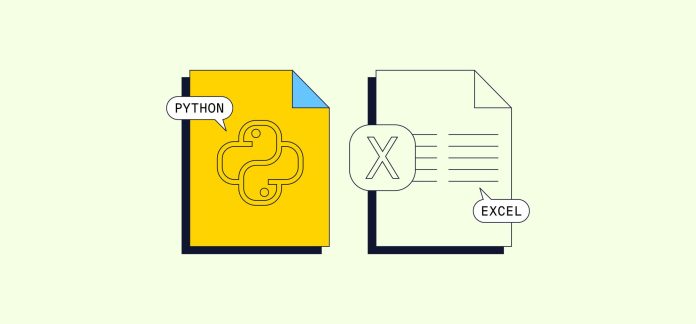
Should You Use Python or Excel? Here’s How to Choose

0
Should You Use Python or Excel? Here’s How to Choose

If your happy place is getting lost inside the pages of a Microsoft Excel workbook, there’s a programming language that you’ll probably get a kick out of: Python. Considered one of the most popular programming languages out there, Python is used for everything from web development to machine learning, and of course, data science.

While there are advantages to using both Excel and Python, “Python is just a little more robust,” says Ada Morse, Codecademy Curriculum Developer in Data Science. The new free Codecademy course Getting Started with Python for Data Science will walk you through how to use Python and Pandas, a library specifically for data manipulation and analysis, to explore, clean, and transform real datasets.

Never coded before? Don’t be intimidated by Python. This course is designed for beginners in mind, and Python has a concise, English-like syntax that reads like a natural (or spoken) language. Here are a few scenarios when you’d want to use Python over a no-code tool like Microsoft Excel, and exactly what you need to start learning the popular programming language.

You’re working with a lot of data.

It might seem like you could add an infinite number of cells to an Excel spreadsheet but there is actually a limit to the number of rows and columns it can hold — 1,048,576 rows and 16,384 columns, to be exact. “Once you’ve got a bigger data set, the advantage of being able to scroll through your data in Excel no longer really makes sense,” Ada says. “The speed of Excel becomes a problem.”

With Python, you can easily work with a very large dataset without sacrificing performance. The Python library PySpark is designed specifically for working with “big data,” which is defined as any data that is too big for a typical modern computer to process and analyze. You can learn more about how to use PySpark in our course Introduction to Big Data with PySpark.

Data scientists often work with lots of different types of data from different sources. While Excel can manage data from multiple sources, Python has libraries that allow you to easily access and process data from lots of other sources. “In a modern data landscape at a company where you’ve got cloud databases, data lakes, and all this sort of stuff, the packages with Python are just a little bit more robust,” Ada says.

The Python library BeautifulSoup, for example, is used to extract data from a website so you can put it into a Python structure called a DataFrame. We’ll show you how to do this in our course Learn Web Scraping with BeautifulSoup.

You’re doing advanced data analysis.

As you move toward more advanced data analytics, you need a tool that can execute sophisticated functions, Ada explains. Excel is a solid entry-level choice for crunching numbers and managing data, but there are hundreds of thousands of Python libraries and packages that can level-up how you analyze, visualize, and understand data. For example, the Python library NumPy can perform numerical operations on large quantities of data. Another library MatPlotLib can be used to generate elegant and interactive data visualizations.

Since Python is so easy to learn and simple to read, you can start mastering more complicated concepts quicker. In the course Getting Started with Python for Data Science, you’ll get to use Pandas and work with real datasets to sort, clean, and analyze data. You can take a closer look at these libraries with the courses Learn Data Analysis with Pandas and Learn Statistics with NumPy. Be sure to explore all of Codecademy’s Python courses — if you already know how to code, you can jump right in with the free course Python for Programmers.

You’d like to incorporate machine learning.

Machine learning is a subset of data science that’s all about teaching a computer to make predictions on its own by picking up on patterns within data. Everything from your social media feed to your smart home appliance relies on machine learning technology.

It’s possible for an Excel super-user to get good enough at using the software to incorporate machine learning and predictions, but it’s much more straightforward with Python. There are a variety of machine learning libraries for Python that you can use to prepare and clean data, choose models to use on the data, and then generate recommendations based on patterns. Some common Python libraries that Machine Learning Engineers use are Tensorflow, sci-kit image, and PyTorch.  

Curious how you can become a Machine Learning Engineer? The Codecademy career path Data Scientist: Machine Learning Specialist will teach you everything you need to know to be job-ready. In this path, you’ll start by learning the basics of Python (you don’t need any experience to get started) and go deep into building neural networks with the language.

When should you use Microsoft Excel?

To be clear: Microsoft Excel is by no means outdated or obsolete, and there are still times when it’s more convenient to use Excel. For example, if you’re working on a very quick project or you need to collaborate on a spreadsheet with several people who may not understand Python or how to code.

The biggest benefit of using Excel is that it’s a “one-stop shop,” Ada says. “All of your data is stored there, and you can create your calculations and visualizations in the same sheet.” If you want to get better at using all of Microsoft Excel’s features, try our free course Analyze Data with Microsoft Excel.

Understanding which data science tools to deploy for a particular project is part of being a Data Analyst. In the new Codecademy career path Business Intelligence Data Analyst you’ll get comfortable using all the tools of the trade, including Excel, Tableau, and SQL.

Start learning how to use Python for data science

These are just some of the reasons why you should learn Python if you want to work with data. By the end of the free course Getting Started with Python for Data Science, you’ll be able to use Python to explore and summarize a dataset, filter data to find specific categories, and format raw data so you can answer a question. And once you get a taste of what you can do with Python, you’ll want to check out all of our Python courses in machine learning, web development, and lots more.

Getting Started with Python for Data Science is also a great way to get introduced to coding. Throughout the course, you’ll pick up fundamental coding principles that will come up again as you learn other programming languages. Once you know one programming language, it’s easier to learn another language because there are so many similarities — and the good news is, whichever language you choose, there’s probably a Codecademy course that will guide you.

Getting Started with Python for Data Science | Codecademy

Work hands-on with real datasets while learning Python for data science.

Learn How To Use Python For Data Science In Our New Course

0
Learn How To Use Python For Data Science In Our New Course

If you’re interested in a career in tech, you probably already know that data jobs are hot right now. Tech runs on data, and data science can be applied to virtually every industry. Chances are, if you think of a field you’re interested in, there are jobs that require data skills. And if that isn’t enough, the pay is generally pretty good too.

Plus, it’s rewarding. Data Scientists blend art and science as they use their technical skills to unearth insights hidden in troves of data, and then tell the bigger story behind the numbers. “It’s empowering to take a bunch of observations — a data set — and discover the patterns in there and turn it into something actionable,” says Michelle McSweeney, Codecademy Data Science Domain Manager.

Excited to learn more? Then it’s time to dig into some data, and we’ll show you how in our new free course: Getting Started with Python for Data Science.

Who is the new course right for?

This course gives you a peek into the life of a Data Scientist. You’ll learn the basics of Python, one of the most popular languages for data science. Then, we’ll show you how to use Python for data analysis and visualization before going over the tools and techniques you’ll need to perform the type of tasks you’ll face on the job.

If you’re considering a career as a Data Scientist, this course is a great first step — but Codecademy Curriculum Developer Ada Morse explains that it can really be helpful for anyone in tech. Most jobs involve working with data in some capacity, and knowing your way around a data set is a valuable skill in any role. “I know a lot of people who aren’t Data Scientists but are the ‘data person’ or the ‘Python person’ on their team, and it can be really helpful,” Ada says.

What will you learn in the new course?

We’ll show you how to use Python and the pandas library to process and analyze data; and by the end of the course, you’ll be able to take raw data and turn it into a format that can answer a real-world data question.

The exercises throughout the course are similar to situations you’d encounter in the professional world, and you’ll learn the practical applications of your new skills along with their conceptual foundations. “The datasets are real; they’re not artificially designed to be nice and neat,” Ada says. “You’re working with data on questions that Data Scientists actually ask, and you’re doing it in Jupyter Notebook, which is where you’d be working if you got a job doing this kind of data analytics.”

Jupyter Notebook is an interactive workspace for developing data science code and visualization. It’s one of the most popular tools in the industry; you’ll find it in almost every Data Scientist’s repertoire. And while we cover Python and pandas in the course, after taking it, you’ll be comfortable enough to use Jupyter Notebook with any other data science language you learn.

Ready to get your hands into some data? Check out our new free course Getting Started with Python for Data Science!

The Learning Network: Nuclear Fusion

0

What do you think has been the most important scientific discovery of all time?

Do You Suffer From ‘Task Paralysis’?

0

Do you ever feel stuck when you find yourself with too much to do? What do you do about it?