

Everyone learns differently. I suppose being motivated to learn is the most important thing. Some learn visually, others by doing, and some by just listening or in mixed ways. I personally like listening, combined with some visual aspects. Of course for languages, practice in real life situations is super important! I design my courses using my personal learning preferences and hope to help learners with similar predispositions.
Dashama: the Alison Publisher helping you heal

15 years ago I started my path as a happiness expert teaching yoga and meditation, as well as holistic lifestyle practices including detox diets and healing methods. I was an athlete most of my life before this, so health has always been an interest, but I had also suffered from many health challenges, such as a thyroid disease in high school, immune issues, addictions with alcohol and other unhealthy habits. When I was 18 I was hit by a car while I was riding my bicycle and the impact caused scoliosis of my spine. The doctors said there was nothing I could do to heal it but when I learned about a yoga teacher who had healed her own spine, it gave me hope and I dedicated my life to this path. Not only did I heal my spine, my addictions, and my heart from a broken childhood, soon my teaching spread rapidly and I went on to help millions of others heal their lives through my online videos and teaching worldwide.
What does a data scientist do?


Catherine Zhou manages the data science team at Codecademy. She’s been working at Codecademy for 3 years and as a data scientist for ten. Because the job title of “Data Scientist” is relatively new, Catherine’s title has ranged over the years from quant to researcher to business intelligence analyst to engineer — but through it all she’s been doing the work in the field that’s known today as “Data Science.”
If you’re not sure what a data scientist does, you’re not alone. In an interview with Lillian from the Codecademy Community Team, Catherine shares:
“I think there are a lot of misconceptions about what data science is, what skills it takes to be a data scientist, and the role of data scientists in the workplace. Data science, as it exists today, is a pretty amorphous space. This can cause confusion and mismatched expectations between data scientists and non-data scientists.”
“It also can lead to imposter syndrome and confusion about career trajectory (I talk to so many people working in data science who aren’t sure if they can call themselves data scientists!). I’m optimistic that this will improve over time, but in the meantime, a big part of my job includes educating others about the field of data science and aligning on expectations.”
In this article, Catherine provides some insight into the world of data science, talks about her day to day, and helps us answer the elusive question, “What does a data scientist do?”
But first… what is data science?
The first step to understanding what a data scientist does is to understand what data science is. The following definition comes straight out of Code Foundations, a Codecademy Career Path designed to provide an overview of the main applications of programming.
“Data gives us information about the way the world works. And information can carry meaning – from a click telling us what someone likes, to toxins in the water signaling a health concern. But data is meaningless unless we do something with it. That’s where data science comes in.
“Data science enables us to take data and transform it into meaningful information that can help us make decisions. Data science is interdisciplinary and combines other well-known fields such as probability, statistics, analytics, and computer science. The work that you might do could range from writing up reports to building machine learning models. No matter what your interests are, data science is applicable – because these days, we have data on everything!”
What does a data scientist do?
In our interview with Catherine, she explains the skills required for data scientists. “Data science is defined as sort of the intersection between statistics, software engineering, and domain or business knowledge. So you have to have a little bit of coding skills, a little bit of statistics skills, and a little bit of knowledge about your business.”
Catherine says she thinks the piece of data science that’s the most overlooked is the business or domain side. As a data scientist, you’ll be working with specific stakeholders, teams, or parts of an organization to use data to help them achieve their goals or answer their questions.
“A lot of companies are trying to figure out how best to integrate data people into their organizations.” As a result, there’s a wide range of ways that data scientists may work with strategy, decision making, and implementation of analysis — and, as you can imagine, the role of a data scientist may look very different depending upon what company you’re working on and what business domain you’re working in!
What skills do data scientists need?
That said, there are a number of skills that are shared by data scientists across the board. If you’re thinking of becoming a data scientist you’ll want to build your skillset in the following areas:
- Descriptive and inferential statistics
- Probability
- Programming (Specifically SQL, and Python or R)
- A passion for diving deep into the data for the specific field you plan to work in
Of course, there’s a whole lot to learn in each of these areas. But Catherine explains that you shouldn’t feel like you have to learn it all:
“I’m always humbled by how much more I have to learn. Originally when I broke into the field I felt really overwhelmed and felt a lot of imposter syndrome about having to learn a lot. But I realized that when you work in data analysis or statistics you end up specializing in one part of it.
“You might specialize in predictive analysis; you might specialize in reporting; you might specialize in machine learning or artificial intelligence. There are so many subsets — usually data scientists will focus on one thing and get really good at it.”
A day in the life of a (remote) data scientist
In her interview with Lillian, Catherine shared a glimpse into what a typical day looked like as a data scientist at Codecademy before we shifted to remote work. Here’s an update on how that has changed in recent months, since we’ve started working remotely.
Growing the team while working from home
Data Science at Codecademy has grown a lot over the last few months, and we’ve added quite a few new team members. We started a few people right before we shut our offices down, and it’s been a challenge figuring out how to shift their onboarding to virtual. As a manager, it’s my job to make sure my team is feeling focused and engaged, which can be really tough during a pandemic. These days, I spend most of my time thinking about how to collaborate effectively through a crisis, and how I and the company can support our team and our learners. The hardest part is taking everything day by day, since we’re not able to plan ahead.
Meetings and written communication
Meetings and communication play a bigger role in my day-to-day than ever before. The DS team gets together regularly to align on projects, share work, and hold virtual pair programming sessions. We try to document everything in writing these days, in order to make sure we’re communicating effectively, and no decision is lost or unclear. We make sure we have write-ups on how-to wikis for debugging and investigations, results for experiments and analyses, team planning docs, and project plans. We do regular code review, and get together to demo and share work for feedback. Having great processes is time-consuming, but documenting knowledge well and having great processes will serve us well for years to come. In many ways, shifting to remote work allowed us to really think about what processes were working well and what wasn’t, and being very intentional about our channels of communication and project prioritization.
Hands-on data science work
At most tech companies, technical managers are expected to do a mix of IC (individual contributor) and people management work. As a manager, I reserve about 20% of my time, or about one day a week, on hands-on data science work. Examples of projects we’ve worked on are: building a model on learner engagement and retention, redesigning our database and ETLs to improve speed/performance, building internal data tools for other teams, designing experiments and choosing the right statistical tests to evaluate results. Lately, our team has been spending a lot of time thinking about developing frameworks to scale Data Science work. This means we’re automating work through scripting to make sure we’re not doing repetitive or manual work.
Unplugging from work
Working effectively during a pandemic can be really difficult, and I try to have empathy for myself and my coworkers when trying to strike the right balance between work and home life. We’re lucky to work in an industry and role that can be done from home. I adopted two cats, named Mu and Sigma after the normal distribution, and try to signal a close to my workday by playing with my cats, calling a friend, cooking dinner, or reading a book.
Is data science right for you?
When asked if she always wanted to be a data scientist, Catherine shared, “This might be weird, but I was also really into probabilistic thinking and used to think about how it applied to my day-to-day decisions. I would try to calculate things like: if I miss this traffic light, what are the chances I’ll miss the next two lights? How much longer would that lengthen my commute?”
If you’ve found yourself trying to make similar calculations, are curious about analyzing human behavior, or get excited about using data to uncover interesting or surprising information, a career in data science may be in your future!
Our Data Science Career Path is designed to give you all the skills you need to become a data analyst, data scientist, or machine learning engineer. Learn more and get started here.
Summer Reading Contest Week 5: What Got Your Attention in The Times This Week?

Our 11th Annual Summer Reading Contest enters its fifth week!
This contest is open to students 13-19 from anywhere in the world. To participate, submit a response by 9 a.m. Eastern on July 17 that answers the questions “What got your attention in The Times this week? Why?”
If you are 13 or older and live in the United States, or 16 or older from anywhere else in the world, post your response in the comment section. If you are 13-15 and live in another country, see the bottom of this post for details on how to submit.
Responses must be 1500 characters or fewer.
What should you choose? Well, as you know from the rules we’ve posted, you can pick anything published on NYTimes.com in 2019 or 2020, including articles, essays, Op-Eds, videos, photos, podcasts or infographics.
So what did you read, watch or listen to this week?
We hope you’ll click around NYTimes.com and find your own great articles, features and multimedia. But we also know that not everyone who participates has a Times subscription. Because all links to Times content from the student features on our site are free, every week we’ll try to help by posting interesting pieces from a variety of sections.
Job Bias Laws Do Not Protect Teachers in Catholic Schools, Supreme Court Rules
U.S. Will Pay $1.6 Billion to Novavax for Coronavirus Vaccine
Supreme Court Lets Employers Opt Out of Birth Control Coverage
Supreme Court Rules Large Swath of Oklahoma Is Indian Reservation
Or, maybe you discovered stories in the Style, International, Sports, Magazine, Arts, U.S., Travel, Science, Health or Smarter Living sections like …
Whatever caught your eye, tell us about it.
Need more details? The contest rules are all here, and you can read the work of last year’s winners here. A quick overview, though:
You can choose from anything published in the print paper or on NYTimes.com in 2019 or 2020, including videos, podcasts, graphics and photographs. (In your response, please include the URL or headline of the piece you pick.)
We’ll post this question each Friday from today through Aug. 14, and you’ll have until the next Friday morning to respond with your picks. Then we’ll close that post and open a new one with the same question.
We’ll choose at least one favorite answer to feature on our site each week. Winners from this week will be announced on July 28.
Feel free to participate each week, but we allow only one submission per person per week.
The contest is open to students ages 13 to 19 from anywhere in the world. If you are 16 or older from anywhere in the world, you can post your response in the comments section. If you are between the ages of 13 and 15 and live outside the United States, use the form below to submit your entry. All entries from the comments section and the form below will be judged together.
Coursera raises $130 Million in Series F round of financing
Today, we’re happy to announce that Coursera has raised $130 million as part of the Series F up round. This financing brings the company’s cash balance to more than $300 million. The round was led by NEA and joined by existing investors Kleiner Perkins, SEEK Group, Learn Capital, SuRo Capital Corp, and G Squared.
Coursera, along with its community of partners, has been at the forefront of preparing individuals and institutions for the Fourth Industrial Revolution. The ongoing pandemic has further accelerated the rate of digital transformation among companies. The jobs of the future will be powered by a highly-skilled and distributed workforce, collaborating virtually to deliver value.
As millions of learners, thousands of campuses and companies, and hundreds of governments turn to our platform, it’s important that we continue to stay well-resourced to serve the world at a particularly challenging time. We will use the additional funding to double down on our product and engineering efforts, expand our job-relevant catalog, and further grow our international presence. In particular, it gives us the flexibility to meet the considerable demand for two of our COVID-focused initiatives — Campus Response Initiative to help universities teach impacted students and Workforce Recovery Initiative to help governments reskill unemployed workers.
The world is facing unprecedented economic disruption, and the need to develop skills for a digital future is even more apparent now. We are deeply inspired by how our community of top educators, enterprise learning leaders, and government partners are coming together to serve the world with generosity, innovation, and dedication. We are here to enable their efforts in every possible way.
Yasser Allaham: “The courses gave me the confidence I was looking for.”

“My name is Yasser Allaham. I am 36 years old. I am from Syria and I live in Damascus. I have a bachelor’s degree in Economics and a Higher Diploma in Marketing and Research Management.”
How did you learn about Alison?
My journey with Alison began in 2012. At the time, I was searching Google for some information and materials related to customer care and services. It was at that point that I happened to discover the amazing and informative website that is Alison.
What was your first course on Alison, and why did you choose it?
My first course was the Diploma in Customer Service. It was very interesting and I found it a very smooth transition when I began testing some of the theory in my work. I found the course easy to understand and to apply so I decided to immediately begin a second course. This was the Diploma in Business Management & Entrepreneurship, another prestigious course containing modern theories alongside interesting subjects.
How have Alison courses affected your career?
Once I finished the courses, I began to see great results in both my attitude and in my understanding of various aspects of my professional career. The courses gave me the confidence I was looking for in starting discussions with my colleagues and work partners because it was apparent I was a well-informed person, especially when it came to new theories and up-to-date information. I didn’t just have the traditional theory that’s taught in universities.
What’s your favourite way to relax from studying?
I find walking outside in open spaces to be a comfortable and suitable way to throw off any pressure I feel from long hours of study or work.
Where are you working and what are you studying now?
Currently, I am working in a bank in Syria as a Credit Control Specialist. Also, I continue to still follow new courses that are related to my domain of Finance.
What’s next for you, in terms of education and work?
The journey of education never stops or is limited by age or degrees, so I always try to follow up what’s new in order to give myself a competitive advantage in a very fast and competitive marketplace.
If you could learn absolutely anything in the world from an Alison course, what would it be?
Perhaps another foreign language, such as Chinese or Japanese.
What would you say to someone if they asked you about Alison? Would you recommend it and why?
Over several years now, I’ve studied 6 Diplomas and 4 other courses in a variety of areas such as Management, Sales, Marketing, Operations and Customer Care. Many friends ask me about the best,and easiest to use, e-learning platform to start their journey in education. The answer was, and still is, Alison. When they ask me what it costs I say “Nothing, just determination and a person thirsty for knowledge.” I’m looking forward to beginning a new course and journey with Alison again soon.
Join Yasser and take a course in Finance now!
Vincent Coffie Kuttu: “Alison offers free online courses to millions of learners.”

“My name is Vincent Coffie Kuttu and I’m from the Volta Region in Ghana. I studied Information Technology at the University of Cape Coast in Ghana and recently completed the Introduction to Information Technology For Managers certificate course with Alison. I like computes because, in my schooling days, I scored high marks in that subject. My strengths are that I take the initiative to work independently, have good leadership skills and am adaptable to any kind of situation.”
How did you learn about Alison?
I was introduce by my lecturer in university who taught his students how to research on the internet and about online courses. I then came across Alison who offer a lot of free online courses to millions of learners. I was amused when I saw my favourite course there and wanted to give it a try.
What was your first course on Alison, and why did you choose it?
My first course on Alison was on IT Management. The rationale behind this was that I really liked business when I was in secondary school. I want to give the course a try since it merges management and information technology together.
What’s your favourite way to relax from studying?
My hobbies are listening to music, playing football and computer games. I also have a passion for teaching kids.
Where are you working now?
I’m currently searching for a job and would like to study more. I would like to get a MSc in Computer Engineering because I would like to be a System Administrator in order to manage my own company in the future. The next course I would like to study on Alison would be Computer Engineering to help me on my way to be a System Administrator.
What’s next for you, in terms of education and work?
My short term goal is to get a job in a reputable company and I am currently searching for a job. My long term goal is to become more a responsible and knowledgeable person and get a respected position in a company. I will one day start up my own business.
What would you say to someone if they asked you about Alison? Would you recommend it and why?
I recommend Alison to anyone trying to study or obtain a grade online because they offer courses with zero charges. Also their instructors offer well-structured topics to their learners.
Vincent’s favourite course is IT Management. Find your favourite free course now.
Tingai Jacob Habakkuk: “Through Alison courses I’ve been able to increase my career options.”
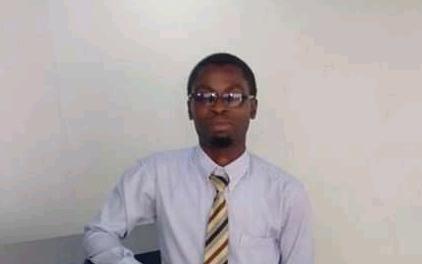
“My name is Tingai Jacob Habakkuk and I was born in Dar es Salaam. I am the 4th born child in a family of four children. My parents were not financially strong and I have gone through tough times. When I was in primary school, one of my father’s friend developed an interest in supporting my education and he opted to fully cover my education. My sponsor took me to Kenya to study and I worked so hard that I achieved grades that gave me direct entry to a provincial high school. I passed my high school national exams with flying colors and gained direct entry into university. However, two months after I got my results, my sponsor passed away. I could no longer support my education and I decided to return to Tanzania. I worked as a Mathematics, Physics and Biology teacher in a local tuition center for 2 years and collected enough money to support my college fee. Later, I joined the Regional Aviation College and did a Flight Operations Dispatch course.”
How did you learn about Alison?
I came across Alison through an online search and I quickly started learning. All along, Alison interactive learning has been equipping me with skills and improving my education. I have done 17 Alison courses and have even more are still in progress.
What was your first course on Alison, and why did you choose it?
My first course was Introduction to the Human Skeletal System. Among others, I’ve completed courses in Customer Service, Information Systems and Psychology. The Operations Management course equipped me with super skills for my work.
How have Alison courses affected your career?
Through Alison courses I’ve been able to acquire quality education, quantify my technical skills, expand my interests and increase my career options, all in a way that is affordable.
What’s your favourite way to relax from studying?
When I’m free, I like to sit down alone in the office, take a glass of water and start covering something educational.
Where are you working now?
Having proved my education ability at the Regional Aviation College, the College took me on as an assistant instructor. A year later, I was employed by an airline company in Zanzibar airport and a few years after that, the college took me on again for the second time as a fully fledged Aviation Instructor. A year later, I got a chance to work at SCI Africa, an ATM company. They trained me and took me on as Engineers Coordinator and I gained great experience. Two years later, Regional Aviation College took me back again as Chief Instructor and Head of Aviation Training. This year, I started my position as Station and Training manager at Equity Aviation, an aircraft ground handling company at Dar es Salaam airport.
What’s next for you, in terms of education and work?
I want to help students who are in financial trouble get a quality education. I’d like to establish an Alison Centre here in Tanzania to help the many people who are not able to afford education.
What would you say to someone if they asked you about Alison? Would you recommend it and why?
Alison is an online education platform that offers a variety of courses across the disciplines and once you sign up, you can pursue a course of your choice. The courses are free. If you pass exams then you can purchase the certificates. I recommend because Alison made me who I am. Reading, learning and gaining knowledge is a continuous process.
Tingai is continuing his education through Alison. Join him by clicking here and starting a course today.
Teodor Vladov: “Alison definitely helped my career a lot.”

“My name is Teodor Vladov. I’m a Chartered Institute of Procurement & Supply qualified procurement professional, with over 15 years of experience within the public and private sectors. My specialties include Procurement & Supply Chain Management, Project Management, Stock Management & Control, Logistics and Tendering and Contracting.”
What was your first course on Alison, and why did you choose it?
I found out about Alison 5 years ago while conducting research. My first course was the Diploma in Supply Chain Management. I chose it as it was the closest match to my career progression intentions.
How have Alison courses affected your career?
Alison definitely helped my career a lot. Firstly, the certifications look well on my CV and this boosts career prospects. Secondly, the knowledge I gained was reflected in my day-to-day work and led to significant improvements in my working processes. And not least, the range of my studies created opportunities for me to give excellent performances in different industries at executive and managerial levels.
What’s your favourite way to relax from studying?
Playing the electric guitar and having fun with my three children.
Where are you working now?
Recently, I started as a Manager at a Logistics and Distribution company that provides services to Amazon. I have more Alison courses that I would like to complete soon. In the meantime, I’m studying for a Chartered Institute of Procurement & Supply Advanced Diploma.
What’s next for you, in terms of education and work?
I want to continue with my personal development, to up-skill and learn about new techniques and newly developed studies. My career goal is to become a Supply Chain Manager at a top performing company.
If you could learn absolutely anything in the world from an Alison course, what would it be?
Problem solving techniques.
What would you say to someone if they asked you about Alison? Would you recommend it and why?
I already recommend Alison to my peers. It’s a reputable education platform that provides courses with high levels of academic content. I particularly like that the assessments are not made too easy to the students and require at least 80% to pass.
Taiwo Afolayan: “Alison really put me on the right track in my career.”

“My name is Taiwo Afolayan. I am an Argitech (an Art & Digital Technologist), a blogger and a designer. I have more than 7 years of experience in the digital arena, a place where innovative problem-solving and technology meet and a place I’m fascinated with.”
How did you learn about Alison?
One fateful day I was searching the internet through Google for a free Graphics Design training course. Alison came up, along with other academy training choices, but I chose to go with Alison instead.
What was your first course on Alison, and why did you choose it?
Graphic Design – Visual & Graphic Design. I chose Graphic Design as my first Alison course because I wanted to get certified by an international institute. I already had over 7 years experience in graphic design before I became an Alison graduate.
How have Alison courses affected your career?
It really put me on the right track in my career as a graphic artist, where I currently work professionally at the moment.
What’s your favourite way to relax from studying?
I watch movies and listen to good music.
Where are you working and studying now?
I am the co-founder and Lead Consultant at Argitech Limited. Argitech Limited delivers solutions on branding, print and packaging, web design and development, data analytics and management, and 2D and 3D animation for start-ups and established brands. I’m also Editor-in-Chief at The Fashionistar Magazine. I am also currently pursuing a master’s degree in Financial Engineering at WorldQuant University in the USA. As a Computer Science graduate and having had experience as a data scientist, I decided to further my studies in financial engineering to understand the relationships between computer science, finance, accounting, mathematics and statistics.
What’s next for you, in terms of education?
Following my MSc programme, I will continue to work on a PhD, while working hard to make my company a profitable business. For my PhD, I would like to study a course related to Sustainable Development Goals.
If you could learn absolutely anything in the world from an Alison course, what would it be?
Finance and Accounting courses, or Project Management. I believe that every project can be accomplished but every project needs proper management. In order to accomplish this, project management skills are needed to develop professionally.
What would you say to someone if they asked you about Alison? Would you recommend it and why?
I’m able to recommend Alison to everyone and anyone because it serves as an opportunity to learn at your speed and to be certified at your will.
Get a head start like Taiwo and take Alison’s Graphic Design course today!
